Trendline Breakouts: How to Read & Trade Them Like a Pro
Technical Analysis Trendlines Breakout Trading
Trendline Breakouts: How to Read & Trade Them Like a Pro
TradeGhost Team · May 6, 2026 · 9 min read
What is a trendline?
A trendline is one of the most fundamental tools in technical analysis. It's a straight line drawn on a price chart connecting two or more significant price points — either swing highs (resistance trendline) or swing lows (support trendline).
Trendlines give traders a visual representation of the dominant direction of price movement, helping them identify:
The current market bias — bullish, bearish, or neutral
Potential areas of support and resistance
High-probability entry and exit zones
The real power of trendlines, however, lies not in the line itself — but in what happens when price breaks through it.
What is a trendline breakout?
A trendline breakout occurs when price closes decisively beyond a well-established trendline. This signals a potential shift in the prevailing market structure — and often triggers a significant move in the breakout direction.
Breakouts can happen in three market contexts, each with its own trading implications: an upside breakout (bullish), a downside breakout (bearish), and a sideways/range breakout (directional move follows consolidation).
Understanding which type of breakout you're looking at is critical to positioning yourself correctly — and avoiding costly false breakout traps.
The 3 types of trendline breakouts — with chart examples
1. Upside breakout
Bullish

Price was making lower highs beneath a descending resistance trendline. After multiple rejections, bulls pushed price through the trendline with a strong bullish candle. This breakout signalled the end of the bearish phase and the beginning of a new uptrend. Notice how price surged significantly after the breakout — a classic bullish continuation.
Key characteristics
Descending resistance line broken to the upside
Breakout candle is typically strong and bullish
Volume often spikes on the breakout candle
Look for a retest of the broken trendline as new support
Target: measured move equal to prior swing range
Trade setup
Entry Close above trendline or on retest of broken line
Stop Loss Below the breakout candle's low
Target Measured move — height of prior range added to breakout point
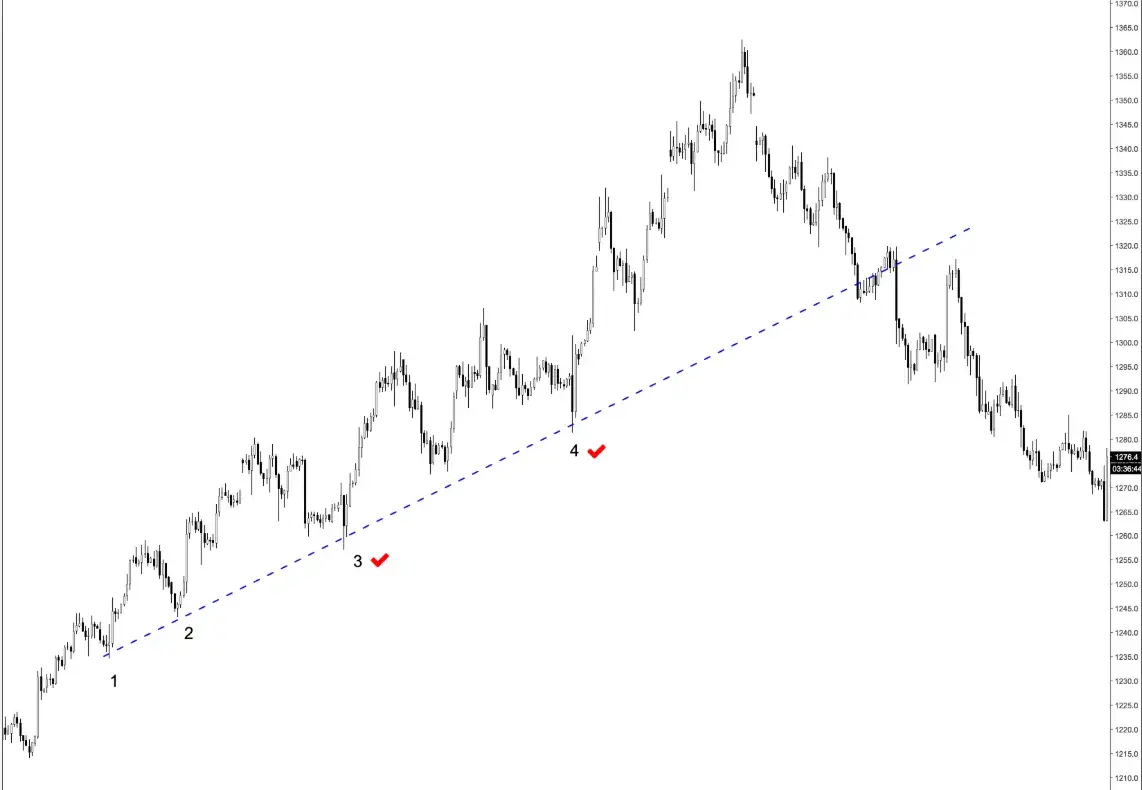
2. Downside breakout
Bearish

Price had been respecting an ascending support trendline, forming higher lows. When price finally closed below the trendline, it signalled that bulls could no longer defend the uptrend. The subsequent sell-off was sharp. This pattern is especially powerful when it coincides with a failed attempt to reclaim the trendline after the initial break.
Key characteristics
Ascending support line broken to the downside
Breakout candle is typically a strong bearish candle
Price often retests the broken trendline as new resistance
Watch for momentum indicators confirming bearish divergence
A failure to reclaim the trendline confirms the breakdown
Trade setup
Entry Close below trendline or failed retest of broken line
Stop Loss Above the breakout candle's high
Target Measured move downward from the breakout point
3. Sideways / consolidation breakout
Neutral → Directional

During a sideways or consolidation phase, price coils between converging trendlines — often forming a triangle or wedge pattern. The breakout direction determines the next major trend. Sideways breakouts can be especially powerful because energy builds during the compression phase. In this example, price broke downward from the consolidation zone, triggering a significant move.
Key characteristics
Price consolidates between two converging trendlines
The longer the consolidation, the stronger the breakout
Breakout direction is not always predictable — wait for confirmation
False breakouts are common — look for a candle close beyond the line
Volume expansion is a strong confirmation signal
Trade setup
Entry Candle close beyond the consolidation boundary
Stop Loss Back inside the consolidation zone
Target Measured move = height of the consolidation pattern
Do's and don'ts of trading trendline breakouts
Most traders know how to draw a trendline. Fewer know how to trade a breakout without getting trapped. Here's what separates disciplined traders from impulsive ones.
✓
Wait for a candle close
Never trade on a wick poke through the trendline. Wait for a full candle body close beyond it on your timeframe.
✓
Look for volume confirmation
A breakout with above-average volume is far more reliable than one on thin, low-volume price action.
✓
Trade the retest, not just the break
Many strong traders wait for price to return and test the broken trendline — offering a better risk/reward entry.
✓
Use confluence
A breakout aligning with a key level, moving average, or indicator signal is significantly more reliable.
✗
Don't force trendlines
A valid trendline needs at least 2–3 clean touches. Lines with too many violations are not reliable.
✗
Avoid chasing false breakouts
If price snaps back inside the trendline quickly, that's a false breakout — exit and wait for a new setup.
Final thoughts
Trendline breakouts are one of the cleanest setups in technical analysis — when traded correctly. The key is patience: wait for a confirmed close, look for confluence, and always define your risk before entry.
Whether it's an upside breakout signalling a new bull run, a downside breakdown triggering a fresh sell-off, or a sideways consolidation finally resolving — the principles remain the same. Structure first. Confirmation second. Trade third.
Practice identifying these setups on historical charts before trading them live. Over time, your ability to distinguish high-quality breakouts from traps will become one of your most valuable trading skills.
Disclaimer: This article is for educational purposes only and does not constitute financial advice. Trading in financial markets involves significant risk. Please read our Risk Disclosure before making any trading decisions.
Last updated: